
A line plot is one of the simplest and most visual ways to organize small sets of data, and it’s often the very first data-display tool students learn in elementary math. But what exactly is a line plot definition? In short, a line plot uses Xs, dots, or symbols placed above a horizontal number line to show how often a particular value occurs. This makes a number line plot an easy entry point into the broader plot definition math concept, since students can literally see each data point and its frequency at a single glance.
Whether it’s recording shoe sizes, pencil lengths, or favorite ice cream flavors, line plots turn raw numbers into something visual and easy to interpret. Throughout this guide, you’ll find practical examples of line plots, teaching strategies, common vocabulary, and answers to the most common questions students and parents ask about this foundational math tool.
Why Is Understanding Line Plots Important?
Learning to build and read a line plot gives students a set of skills that reach far beyond a single math unit.
Organizing and representing data becomes far more intuitive with a line plot, since it displays both the individual data points and their frequency in one clean visual. This makes it simple to answer questions like “which value shows up most often?” without needing to scan through raw numbers.
Analyzing data is another major benefit. A well-built line plot makes clusters, gaps, and outliers immediately visible. Students can quickly spot the mode the most frequently occurring value while also noticing unusually high or low results and how spread out the data really is.
Finally, line plots build foundational skills that carry directly into more advanced graphing concepts. The habit of marking values along a number line prepares students for plotting coordinate points, reading histograms, and interpreting virtually any graph built on a numerical scale.
Teaching Strategies to Develop Understanding of Line Plots

The most effective way to teach line plot is by combining hands-on data collection with visual representation and real-world context.
Start with Hands-On Activities
Letting students gather their own data before building a line plot makes the concept far more meaningful than working from a pre-made worksheet.
Jump and Graph Activity: Take the class outside for an active measurement lesson. Have each student take a turn jumping as far as they can, then measure the distance to the nearest inch or half inch. Back in the classroom, record every jump length and build a line plot together, marking an X above each recorded distance. Once complete, discuss which jump lengths appeared most and least often, and what that pattern reveals about the class’s overall range of jumping distance.
Read More: Understanding Solid Shapes in Mathematics
Incorporate Visual Models
Visual tools help students see exactly how raw data transforms into an organized line plot.
Interactive Line Plot: Draw a large number line on the board and hand out sticky notes for students to use as data markers. For example, when collecting data on how many pets each student has, students place their sticky note directly above the matching number on the line. This hands-on, visual approach reinforces how data gets organized and interpreted directly on a number line plot.
Use Real-Life Applications
Connecting line plots to familiar, real-world situations makes the concept stick.
Survey Results: Run a simple class survey, such as “How many hours do you read each week?” Record the responses and build a line plot together to analyze the results. Ask guiding questions like “What’s the most common amount of time?” or “How many students read more than 5 hours a week?” This kind of real, relatable data helps students see line plots as a genuinely useful tool, not just a classroom exercise.
Vocabulary Related to Line Plots
Understanding a few key terms makes line plots much easier to teach and learn:
- Number Line: The horizontal line marked with numbers that serves as the foundation of every line plot.
- Data: The raw information collected and displayed on the plot.
- Frequency: How many times a specific value appears within the data set.
- Scale: The full range of numbers on the number line, which must be wide enough to include every data point collected.
Common Misconceptions About Line Plots
Another common confusion involves misreading what the Xs actually represent compared to the numbers on the scale. Students sometimes assume that two Xs stacked above a spot mean the value itself is “2,” when in reality, the number line shows the data’s value, while the stacked Xs show how many times that specific value occurred. Having students verbalize this distinction out loud for example, “This shows that three people measured 15 cm” helps cement the difference.
A third challenge involves building a consistent, evenly spaced scale that captures the full range of collected data. Teaching students to first identify the smallest and largest values in their data set, then choose a scale with even spacing that accommodates every point, solves this issue effectively. Practicing blank number lines before adding any data at all builds this skill early.
Line plots remain one of the most foundational tools for teaching data analysis in elementary grades, linking number line fluency directly to meaningful data representation that students will continue building on for years.
Line Plots in Mathematics Worksheets
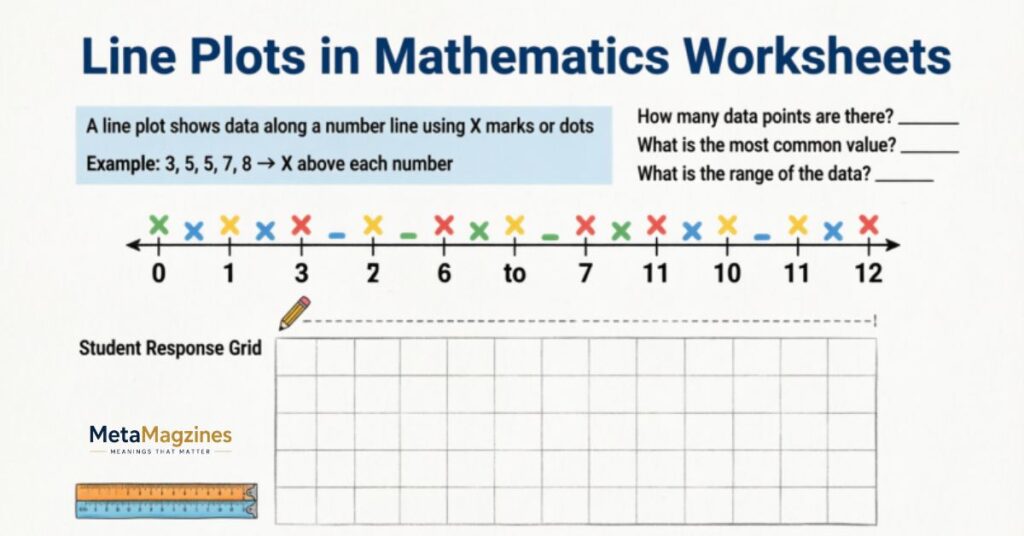
Printable line plot in mathematics worksheets give students structured practice building and reading line plots independently. These worksheets typically include a blank number line, a small data set to plot, and follow-up questions that test whether students can correctly identify the mode, range, or specific frequency values from their finished plot.
Line Plot in Mathematics Examples
Real classroom line plot in mathematics examples often include measuring pencil lengths to the nearest quarter inch, tallying the number of siblings each student has, or recording daily temperatures over a two-week period. These simple, relatable data sets make it easy for students to practice building accurate, evenly scaled plots.
What is a Line Plot 3rd Grade
At the third-grade level, a line plot typically introduces students to measurement data recorded in whole numbers, halves, or quarters, such as the length of classroom objects measured to the nearest half inch. The focus at this stage is on accurate measurement, correct plotting, and simple frequency-based questions.
Line Plot Examples
Beyond classroom measurement tasks, common line plot examples include tracking the number of books read by each student in a month, recording test scores across a class, or plotting the number of pets owned by each family. Each example reinforces the same core skill: representing frequency clearly along a number line.
Line Plot Graph
While often used interchangeably with “line plot,” a line plot graph specifically refers to the finished visual the completed number line with all data marks in place. This finished graph allows for quick visual analysis, making patterns like clustering or outliers immediately obvious.
Line Plots 4th Grade
By fourth grade, line plots typically expand to include data with fractional units, such as measurements to the nearest eighth of an inch. Students are also expected to solve problems involving addition and subtraction of the data shown, such as calculating the difference between the longest and shortest measured item.
Line Plot Example for Students
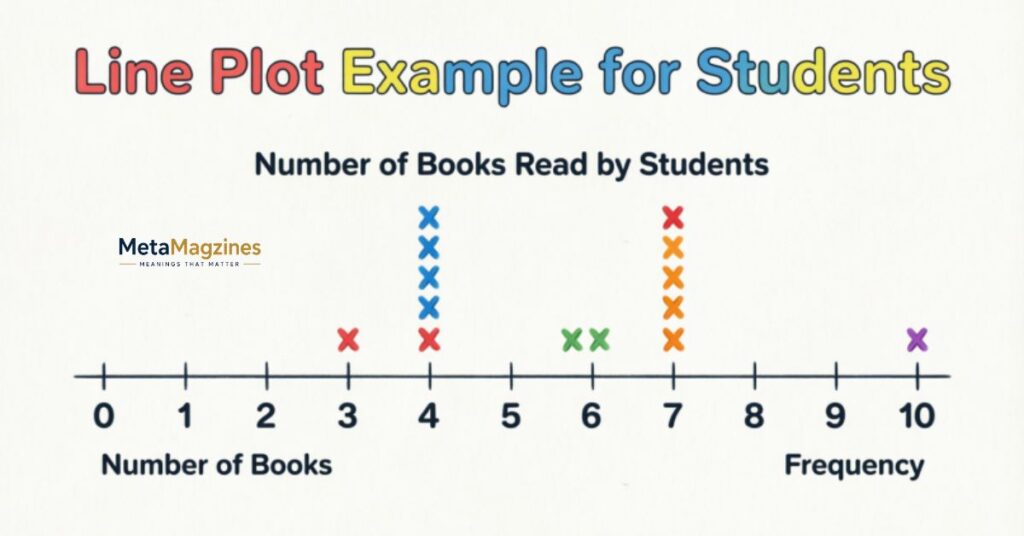
A simple, relatable line plot example for students might involve recording how many hours each classmate slept the night before, then plotting the results to identify the most common amount of sleep. This kind of everyday data set keeps the exercise engaging while reinforcing the core mechanics of building a plot.
Line Plot Questions
Typical line plot questions ask students to identify the mode, calculate the range, determine how many data points fall above or below a certain value, or compare two different data clusters within the same plot. These questions test both visual reading skills and basic numerical reasoning.
Frequently Asked Questions
What are line plots in math?
Line plots are visual tools that display data using marks above a number line. They show how often each value occurs in a data set.
What is a plot line example?
A common example is plotting the number of pets each student has, marking an X above the matching number for every student surveyed.
What is meant by line plot?
A line plot is a simple graph that shows the frequency of data points along a number line using marks like Xs or dots.
What are the 7 types of lines in mathematics?
Common types include horizontal, vertical, straight, curved, parallel, perpendicular, and intersecting lines, each describing a different geometric relationship.
What are the 12 types of lines?
Beyond the basics, geometry also classifies lines as diagonal, transversal, oblique, secant, tangent, skew, ray, line segment, concurrent, collinear, asymptotic, and zigzag lines.
Conclusion
A line plot offers one of the clearest, most accessible ways for students to organize and interpret small data sets. From understanding the basic line plot definition to exploring real examples of line plot in the classroom, this tool builds a bridge between simple number line skills and more advanced graphing concepts used throughout later math education.
Whether students are measuring jump distances, tracking survey results, or plotting pencil lengths, the process of building a number line plot strengthens their ability to spot patterns, identify frequency, and read data with confidence. With hands-on practice, clear vocabulary, and attention to common misconceptions, students move from simply drawing marks on a line to genuinely understanding what that data represents and how to use it meaningfully.

